
The Education Paradox in the Freely Associated States
Micronesian Stick Chart Institute (MSCI)

Across the Freely Associated States ( the Federated States of Micronesia (FSM), Republic of the Marshall Islands (RMI), and Palau), decades of development assistance have poured into the education sector. Budgets have grown, partnerships have expanded, and reform plans have been drafted. And yet learning outcomes are stagnating or, in most cases, getting worse.
How is it that more money, better access, and global attention haven’t translated into better educational results for children in the region? This is the paradox at the heart of education in the Freely Associated States: more money, fewer students, and for some, flatlining or declining outcomes.
Learning Gaps Revealed: What the UNICEF Reports Show
UNICEF’s most recent assessments (2024) reveal deep and persistent gaps in foundational learning across the Freely Associated States. Despite modest improvements in enrollment and some infrastructure investments, proficiency in literacy and numeracy remains low, particularly in FSM and RMI.
In the Federated States of Micronesia (FSM), only 35 percent of Grade 5 students are proficient in reading, and even fewer meet expectations in mathematics. The situation is most acute in Chuuk State, where geographic isolation and teacher shortages compound the crisis. Dropout rates and irregular attendance remain concerns, particularly for boys in outer islands.
In the RMI, the figures are similarly troubling. Just 40 percent of students reach proficiency in literacy by Grade 5, with numeracy trailing even further behind. Girls perform slightly better in reading, but boys lag across all subjects. The reports also highlight a concerning lack of early childhood education (ECE) access, which is strongly correlated with later learning gaps.
Palau, while significantly outperforming its FAS counterparts, still faces equity challenges. Urban schools boast nearly universal proficiency, but rural and outer island students fall behind, especially in math. Gender disparities persist in secondary pathways, with fewer girls entering technical and vocational education tracks.
These findings underscore the urgent need for targeted interventions - especially in the early grades - along with better teacher training, culturally relevant curricula, and learning support for disadvantaged students.
A Surge in Spending

Estimated education funding to FSM, RMI, and Palau (2000–2024), including Compacts of Free Association (Compacts), Supplemental Education Grants (SEG), and donor support such as the World Bank, showing RMI outpaced FSM in total education funding in recent years.
Thanks to the Compacts, FSM and RMI receive significant sector grants, including SEGs, while Palau benefits from similar Compact-related aid. Over the past 20 years, education funding has steadily increased in all three countries.
By 2024, per-student spending from Compact and SEG sources reached:
$1,143 in FSM
$1,650 in RMI
$1,867 in Palau
These are annual estimates based on population and funding data and represent a real increase over prior decades. Yet, compared to countries like the U.S. - where public education spending ranges between $13,000 and $20,000 per student annually - the FAS still face serious resource constraints.
Yet even when compared to other small island states rather than large economies like the U.S., the funding gap remains stark. For instance, Mauritius - a small island nation widely recognized for its strong education outcomes - invests over $6,700 per student per year (PPP-adjusted, meaning it buys roughly the same quantity and quality of educational resources as $6,700 would in the U.S., even if the nominal spending in Mauritian rupees is lower). This is more than three times what the Freely Associated States invest on average. Mauritius’ consistent prioritization of education, coupled with effective allocation of resources, has led to near-universal literacy and high school completion rates. The contrast suggests that small island size is not inherently a barrier to strong educational outcomes, but underinvestment and inefficient spending can be.
Interpreting the School-Aged Population Trend
The chart below illustrates the change in the school-aged population (ages 5–19) across the Freely Associated States from 2010 to 2021. The data, drawn from official government sources including census reports and education statistics digests, reveal a modest but meaningful decline in the number of students in most jurisdictions. For example, FSM's school-aged population dropped from approximately 37,000 in 2010 to around 32,687 in 2021, reflecting outmigration and declining birth rates. RMI’s population also declined slightly, while Palau’s remained relatively stable but small.
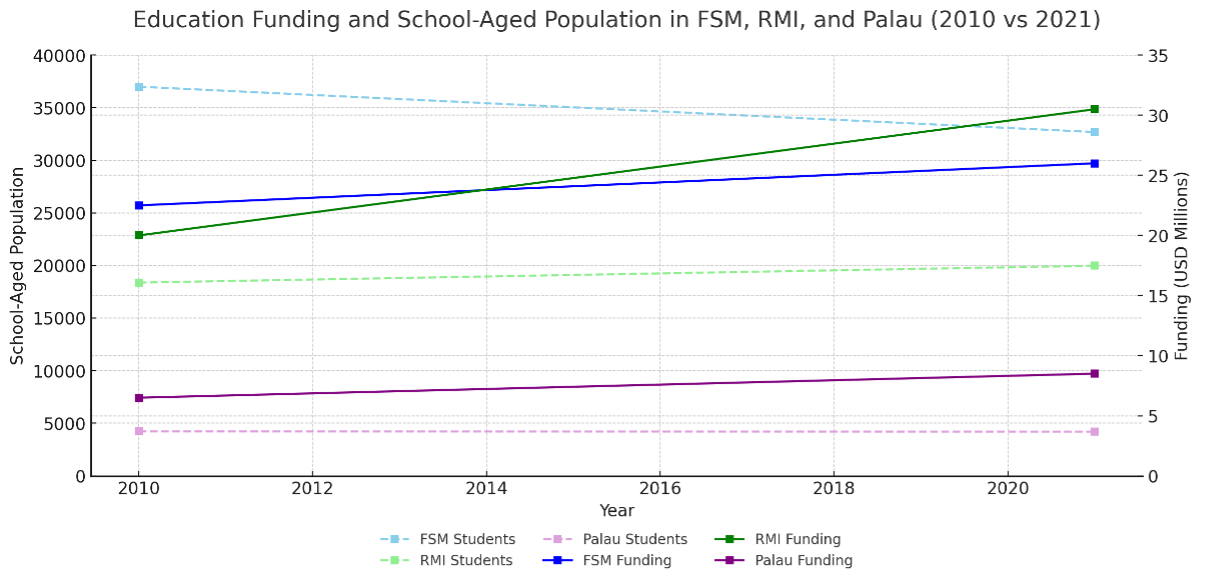
This demographic trend is critical when assessing per-student spending increases - fewer or minimal increases in students mean more funding per head, even if total budgets remain flat. However, the gains in per-student funding have not translated into improved outcomes, as proficiency rates remain stagnant or declining in FSM and RMI.
It’s important to note some limitations of this data:
Population figures are approximate and depend on cohort aggregation (5–9, 10–14, 15–19), which may vary slightly between census years.
Migration, particularly among youth, may distort annual trends that aren't captured in multi-year census snapshots.
This data does not account for enrollment rates, which may differ from population-based estimates.
Nonetheless, the chart underscores a key point: the education sector is serving fewer or the same number of students with more money but not with better results.
A System Strained by Misalignment
Where the money goes is just as important as how much is spent. In both FSM and RMI, more than 95 percent of education budgets are spent on salaries and personnel costs. A 2003 FSM education review reported that “wages, salaries and associated staff costs account for over 97 percent of the state budget for education.” In RMI, a 2013 U.S. Department of the Interior review confirmed that Compact funds were largely consumed by personnel expenditures, housing, food, and utilities. This leaves little room for textbooks, classroom materials, teacher training, or maintenance of school facilities, especially in outer islands. The result is a system that may pay its staff but struggles to deliver quality learning.
Palau’s Caveated Success
Palau appears to be an exception. Grade 5 literacy and numeracy proficiency reach as high as 98 percent, a remarkable figure by regional standards. With a centralized education system, smaller population, and stable governance, Palau has built a model that other FAS nations might learn from.
Yet even here, the story is complicated. Gender disparities persist, especially in science and technology tracks. Rural students still face uneven access to early education and enrichment. And while overall numbers are strong, equity challenges remain just below the surface.
The Global Benchmark: Human Capital Index
To understand the broader impact of educational shortfalls, the World Bank’s Human Capital Index (HCI) offers a compelling perspective. The World Bank’s Human Capital Index (HCI) measures the expected productivity of a child born today based on their access to quality health and education, offering a snapshot of how well a country is investing in its next generation.
FSM: HCI = 0.51, meaning a child born today is expected to reach only half of their potential productivity. The learning-adjusted years of schooling stand at 7.2, with test scores averaging 380/625.
RMI: HCI = 0.42, signifying that children may reach just 42 percent of their capacity, compared with regional peers like East Asia & Pacific (59 percent). The breakdown shows expected school years of 9.4, but learning-adjusted years drop to 5.7.
Palau: HCI = 0.59, reflecting stronger outcomes in education and survival, though still far from the productivity levels of fully optimized systems.
These numbers paint a stark reality: despite decades of external support, FAS education systems are not effectively guiding children toward their full potential in education and health.
The Missing Piece: Domestic Commitment
There is no doubt that the Compact has provided a crucial lifeline. But long-term transformation of education in the FAS will require greater ownership from the governments themselves. Currently, FAS governments contribute only a small portion of the total education budget from domestic sources. This undermines accountability and reinforces dependence on foreign aid. To truly shift outcomes, FAS leaders must:
Increase local budget allocations
Reform budget priorities to focus on student learning
Create feedback systems that reward progress
Engage communities in oversight and improvement
Compact funding can support infrastructure and personnel, but the vision, reform, and long-term drive must come from within.
Reform Before Regression
The education sector in the Freely Associated States is at a crossroads. More money alone will not fix it. What’s needed is smarter spending, stronger leadership, and a shift in mindset—from compliance to commitment, from aid-dependence to ownership. Governments must also be willing to confront uncomfortable truths about outcomes, invest in reforms grounded in local context, and execute bold changes where necessary. This includes exploring innovations such as culturally relevant online learning and blended models that could help bridge geographic barriers and improve equity, especially for students on outer islands and in remote areas.
Sources
FSM Census (2010):
https://www.sboc.fm/index.php/documents?task=document.viewdoc&id=65
FSM Education Review (2003):
https://archive.iwlearn.net/sprep.org/att/IRC/eCOPIES/Countries/FSM/21.pdf
FSM Education Statistics Digest (2021):
https://www.national.doe.fm/wp-content/uploads/2023/03/FSM-NDOE-Education-Statistics-Digest-2021.pdf
Palau Census (2015):
https://www.palaugov.pw/wp-content/uploads/2017/10/2015-Census-of-Population-and-Housing-.pdf
Palau Population Estimate (2021):
https://data.worldbank.org/indicator/SP.POP.TOTL?locations=PW
RMI Census (2011):
https://rmi-data.sprep.org/system/files/Marshall_Islands_Census_2011-Full.pdf
RMI Census (2021 Summary via PIHOA):
https://www.pihoa.org/wp-content/uploads/2024/05/2022-RMI-Rapid-Report_Final_09May.pdf
U.S. DOI Compact Review for RMI (2013):
https://www.doi.gov/sites/doi.gov/files/uploads/second-5-year-review-of-compact-for-the-rmi.pdf
UNICEF FSM (2024):
https://www.unicef.org/pacificislands/media/3146/file/FSM%20SitAn%202024.pdf
UNICEF Palau (2024):
https://www.unicef.org/pacificislands/media/3143/file/Palau%20SitAn%202024.pdf
UNICEF RMI (2024):
https://www.unicef.org/pacificislands/media/3141/file/RMI%20SitAn%202024.pdf
World Bank Human Capital Index – FSM:
https://thedocs.worldbank.org/en/doc/7c9b64c34a8833378194a026ebe4e247-0140022022/related/HCI-AM22-FSM.pdf
World Bank Human Capital Index – Palau:
https://humancapital.worldbank.org/en/economy/PLW
World Bank Human Capital Index – RMI:
https://thedocs.worldbank.org/en/doc/7c9b64c34a8833378194a026ebe4e247-0140022022/related/HCI-AM22-MHL.pdf